How Your Disorganized Data Is Destroying Your Business – And What You Can Do About It
85.1% of businesses encounter data quality issues once too often — if you have a sales or customer support force and prefer to belong to the top 14.9% this is for you.
It is for those who want a data strategy that creates clarity AND helps you make the right business decisions. And they want to start TODAY.
Forbes says you can have a 5-6% higher output and productivity than your competitors, with data-driven decisions – data that is organized, correct and relevant.


A confession
I’ve seen some really good, intelligent, people lose their job because they couldn’t figure out how to work with data in the right way. I don’t want that to happen to good people. But at some point it’s just too late.
And yes, of course I also want you to pay me (guilty admission), but foremost I want to give you an A to Z rundown of what you can do to save your data today — and start making decisions that grow your ROI (by at least 56%).
If you already know your disorganized data is crushing business, learn how I can help you.
I couldn’t believe my eyes when I saw the dashboards they’d been working on for 2 years
Quite recently, a business owner contacted us for some data management assistance for a project they had been working on for quite a while now.
There were two problems continuously happening:
- The dashboard was breaking down time after time
- They thought they were looking at the right data and steering their business on it (I’ll tell you why this is a problem down below)
Imagine the amount of invoices that brings.
And I’m not even talking about the fact that one of the data dashboards looked like a baseball field.

It was way worse. All too often I see that the data is all wrong, yet presented as if it is the correct data.
The balls…
How can you present data for business intelligence with so much confidence and be so wrong about it?
You can’t run a business on false data as it will lead you to make the wrong decisions and leak money without finding out where it’s leaking from.
Great business decisions start with displaying the right data. And that starts with having the right data (under your control).
And when you have the right data, you can finally display that data. The dashboards don’t have to be pretty…

… at first.
Before I made this dashboard (I made it pretty in a later stage, which I’ll show you), I took a step back.
Slowed down.
What took 2 years for false data, yet without a solution, took only 2 months with our approach, the Data Goldmine approach, to fix it all.
The 3 Steps To Creating Your Own “Data Goldmine” To Make The Right Business Decisions
Gartner estimates that within the next few years, 90% of corporate businesses will explicitly mention information and data as their critical enterprise asset.
The data-driven future is already here.
To help you create your own data mine and be a part of that future, here are the three practical steps you need to take:
There are 3 steps to create your Data Goldmine successfully.

Step 1: Discover your KPIs, OKRs, sources, destinations, needs and wants.
Step 2: Collect and visualize data to fit the purpose.
Step 3: Make it work in the long run (I’ll also mention the mistakes you should never make)
I’ll walk you through all these three steps and show you why this strategy works like a charm. I will also show you everything you’ve been doing wrong so far. But first, let’s take a step back.
What most companies do is assign a job to someone with the exact description of what needs to happen.
Every week you’re getting updates. There’s not much you can see yet, but you trust it’s all going in the right direction until delivery day.
You’re opening your inbox, expecting clear and concise data overviews (as you asked for) and end up with the top view of a baseball field on your screen 🤯
This is not what you briefed at all. Now, there’s not only a lot of work still to be done but also a lot of time that needs to be spent. Again, you’re running over budget already.
Now what?
Step 1: Determine what you already have and what it is you really need
What You Can Learn From A High-Performing Coach
My inbox is loaded with newsletters, but there are not many I read. A couple of months back, there was one email from Rich Litvin that really caught my attention. It had the subject line “How to be successful (really) fast…”
It caught my attention because I like to go fast. But going fast is not always the place to start.
Here’s an excerpt:

Now, Rich is a high-performing coach. What can your business learn from a high-performance coach?
- If you want to go faster, look further ahead
In a fast-moving project, focusing on immediate tasks can be overwhelming. “To go fast, look far ahead.” By aiming at long-term goals, you manage projects more smoothly and move faster without chaos. - If you want to go faster, loosen your grip
I realized I was micromanaging too much. A simple tip changed everything: “Ease up your control.” This allowed the team to work more freely, bringing better ideas and quicker adaptations, which improved productivity. - Go slow to go smooth. Go smooth to go fast.
“Smooth operations lead to faster results.” By making sure processes are efficient, better performance naturally follows. - Count what counts.
It’s easy to get caught up in impressive metrics. But the real game-changer is focusing on key metrics. Look at the indicators that really drive success, which should always be front and center.
Look Through Their Eyes
At the beginning of a project, you need to be as annoying as you can be.
First, you want to understand how they’re currently doing their job on a day-to-day basis. If you do not understand that, there’s no way you can design a proper data solution that works for them.
Your goal is to understand their systems better than they understand them.
Dive into the systems. Ask how they know something is working or when something is not working. Write down the exact steps they’re taking; the idea is to get them replicated.
Later on, you will have to follow these steps. Once the data product is finished, you can use this to validate if you’ve done your work right.
It might seem daunting now, but it will save your life once you have to deliver (error-free).
Understand What’s Important To Them: The Power Of Workshops
Workshops aren’t useless. At all. They’re one of your greatest tools which you can use to extract information from everyone.
There are some amazing resources to give workshops, like the Hyper Island Toolbox.
Workshops don’t have to be fluffy. Or vague. As long as you do it right.

Use it to extract information, you want to:
✅ Understand the goals. What results are they trying to get?
✅ What are the KPIs? And OKRs?
✅ What domains are people working in?
✅ Who needs access to what data?
✅ What are your processes currently like?
✅ What do you do in terms of data security?
Forrester says that even a small increase in data accessibility can increase the net income of a Fortune 1000 company by $65 million.
With the right answers to these above questions, you can potentially increase your business revenue by tens of millions of dollars – which is no small feat at all.
Sources And Destinations
Nothing beats flowcharts.
Once you know where you’re headed it’s important to start mapping out all the sources you might want to use.

This is not the moment to think really hard and make sure everything is qualitative. It’s time for quantity right now.
Write down everything you can think of. Don’t be shy, there are no right or wrong answers here.
Then, for every source that you have to use, take time to map all the information you need from there. Be precise here so you won’t get confused.

Make Super Ugly Drafts (At First)
The most important thing during any project is communication.
And communication is not just written text or voice. The more senses you can get in, the better. That’s why I always recommend different means of communication: video, audio, image and text.
Today you can easily create visual aids using tools like Loom and Figma.
Gather all the resources you have and start making wireframes. As ugly as you can.
Wireframes are used early in the development process to establish the basic structure of a page before visual design and content are added.
Here are some key elements of wireframes in the context of design thinking:
🎯 Wireframes help focus on the functionality without the distraction of visual design elements like colors and typography. This allows stakeholders to focus on effectiveness first.
💬 They serve as a communication tool between designers, developers, and stakeholders, making it easier to understand project requirements and discuss the functionalities.
🚀 They can be rapidly created and modified, allowing teams to explore different approaches to solve user problems effectively.
🤑 Creating wireframes is a cost-effective method to test and iterate. Changes can be made quickly at this stage without extensive coding or design.

Repeat this iteration process until all ideas are visualized and everyone is 100% happy with the direction.
Now that’s done, it’s time to prepare for the real work to be done.
Write It All Down
Once you have a good idea of what needs to happen, it’s time to create a scope for the implementation.
A scope determines the focus of the project you’re about to embark on. It determines what will go in and what will be left out. Setting the scope is crucial for managing a project effectively and ensuring that the team remains focused on working on the right challenges.

In a good scope you:
✏️ Define the problem. And do that in a way a 6-year old would understand. Including images and videos.
⚙️ Make tasks small enough, making sure the whole project does not get too complex at a time. Having smaller tasks takes care of managing all the moving parts.
👨🔬 Once all tasks are scoped, it’s easy to allocate resources to a project. Making sure you don’t overpay and are not understaffed.
🔬 It’s the last step in alignment. You refine these tickets together with stakeholders. Making sure that what is unclear or downright false gets corrected.
🚀 While the scope sets the initial boundaries. It makes it easier to change. As the team learns more about the project new insights can be easily accommodated.
Want to discover in 1 day what you need?
Step 2: Getting The Data, Making It Readable And Send It To The Places You Need It
You now have almost everything to get started. Except for one thing.
If you’re working with data, chances are high you’re working with third party vendors. Your data is scattered around those vendors, and you need to collect it.
Collecting Data From Third Party Vendors
Most vendors have APIs nowadays, but not all. Some information you’ll have to scrape (i.e. get in non-conventional ways), and some data is currently manually scored.
The first step is to understand what is what:
🕸️ What data can be fetched via API? And if so, what kind of API is it?
🎛️ What data is currently scored manually?
🧩 What data can you really not get? And can you potentially overcome that?
In this step it’s important to find a way to bypass the known “we cannot get that data” – obstacle. The obstacle is the way – for the stoics between us.
Find out how to get the data from all sources. And have that documentation ready. You need it later.
Many companies have attempted to create a highly centralized data system, or a single source of truth if you will. Because that makes it easier to control the data.
You think…
Single Source of Truth vs Multiple Version of Truth
According to Peter Drucker, nicknamed the father of modern business management, you need to distinguish data from information. He says that information is “data endowed with relevance and purpose”.

Raw data might contain millions of data points, which is hard to interpret without transforming, filtering and enhancing it.
That’s why a lot of companies are choosing a centralized data system, or single source of truth. This is easier to control and is necessary to keep data readable. But it can be very limiting and is not flexible at all.
This makes it harder to turn it into actionable information.
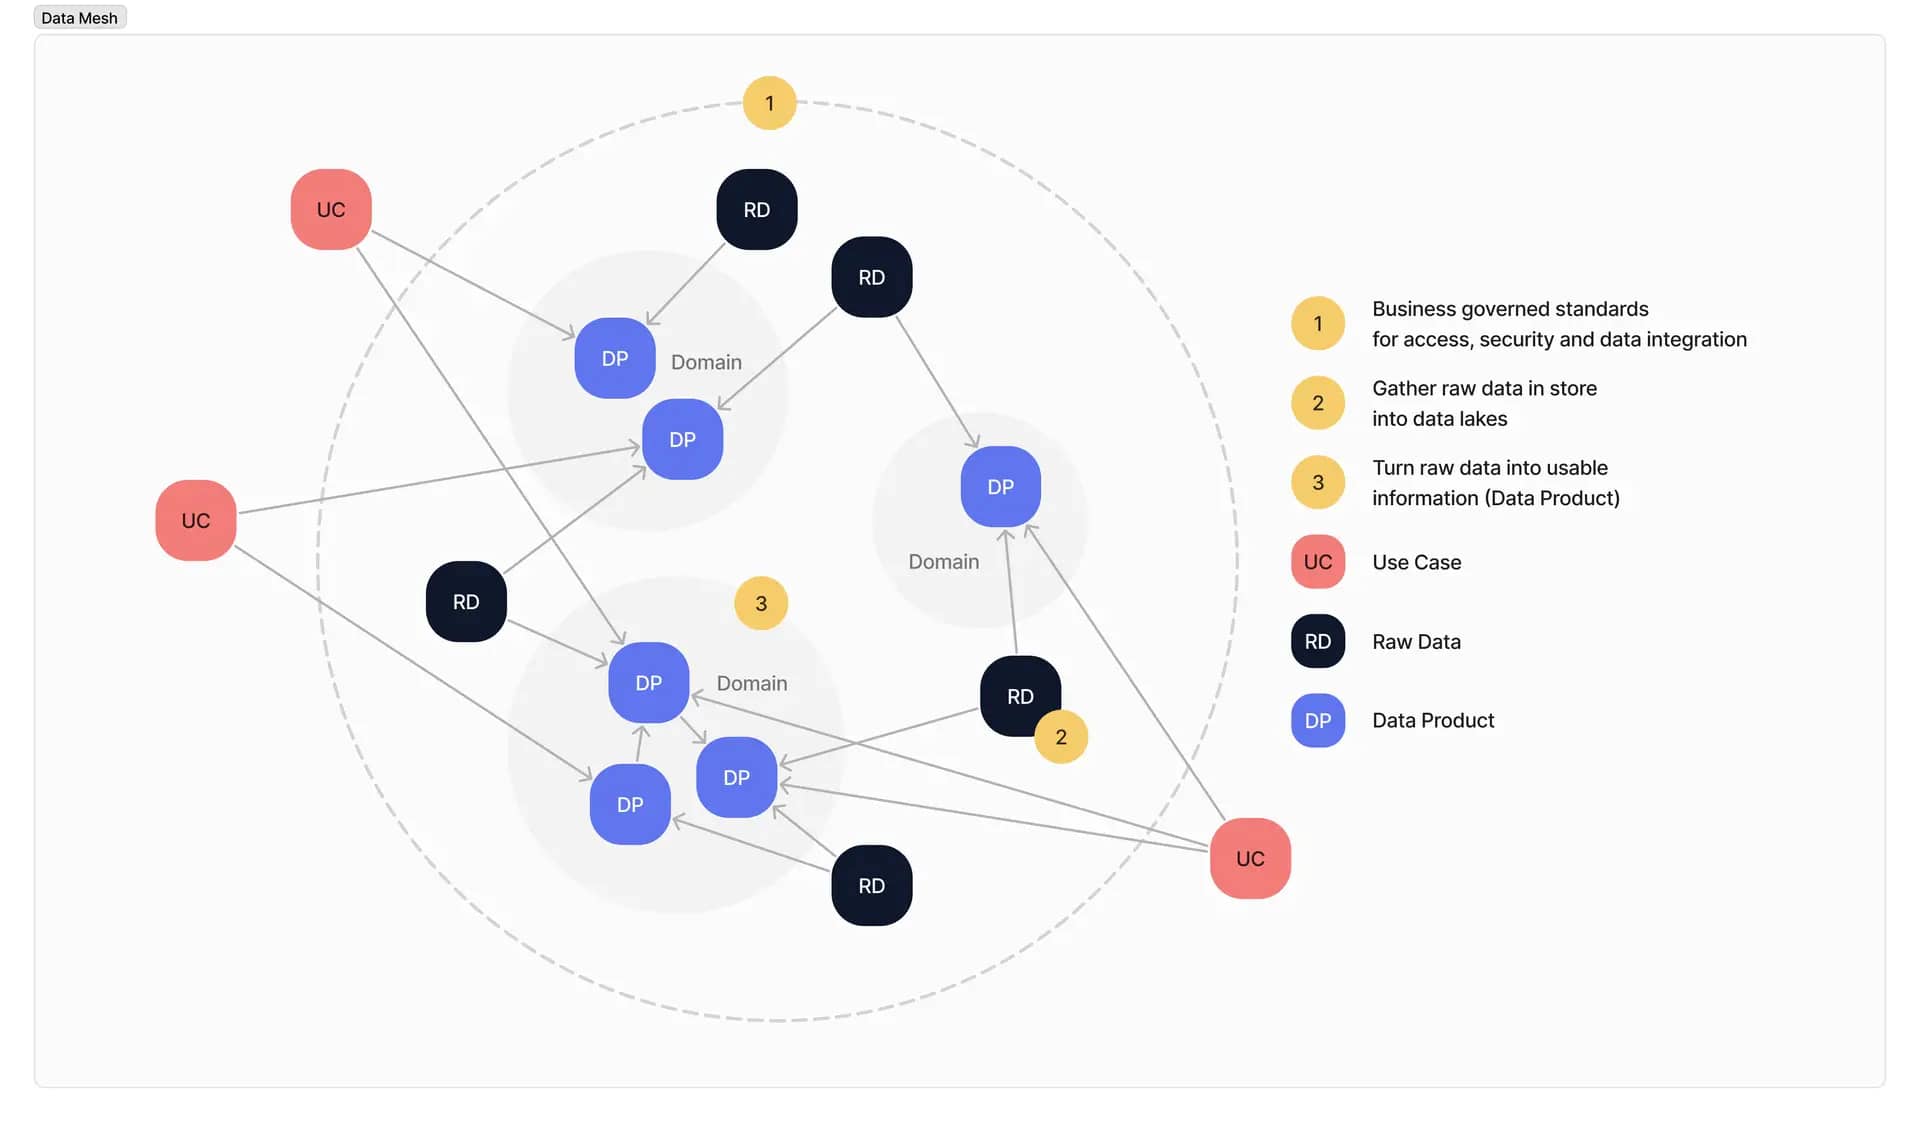
You need a more flexible way of dealing with your data. That’s why I suggest you start with multiple versions of truth. This gives you and your team the flexibility to design per domain what is relevant information to your team.
Specific departments have specific needs.
I suggest that you first save all your data in a data lake. A data lake is a store where you save an unlimited amount of real-time data.
Data comes from various sources and is stored into your data lake in its original, raw, format.
But why would you do that if you want to make things simpler and more readable?
Flexibility.
Once you have the data in your data lake, you can do with it whatever you want. From the data lake you can create centralized data warehouses, even per domain if that is what you want.
And if you decided to change the structure of the data (because you made a mistake) it’s easy to do. You don’t have to go back to redesign the whole architecture, as you already have the original.

Add Your Research To The Scope
Now it’s time for that documentation.
If you’ve done your work right, there are tickets that mention you have to connect a data source.
A developer cannot do his work before he knows exactly what needs to happen. Luckily that’s easy, as raw data will be stored to a data lake.
However, everything needs to be noted down. Everything. Trust me, if you don’t, things go south and you find yourself explaining over and over again.
There’s a trick to people creating exactly what you need. And the trick is: loosen your grip.
Once Everything Is Written Down, You Let Go And Your Team Gets To Work
Design thinking is all about letting go to create magic.
In this method the stages of planning, refinements and retrospectives play vital roles. This is where you set out the framework for your team.
Planning is vital for setting the right stage for a project. The biggest chunk happens before the project starts. I’ve covered this part extensively in the discovery phase. During the project this should be a quick exercise. To recap, you:
✅ Define the scope and objectives.
✅ Understand the problems that need to be solved.
✅ Set timelines and assign resources.
Refinements are needed to align with your team. Ideally you want to refine every week. This is where the iterating comes in. Refinement aims to:
✅ Make improvement on the scope or deliverables based on feedback. This allows solutions to evolve.
✅ Improve quality, clarity and functionality.
✅ Addressing new challenges that come up in the process.
Retrospectives happen at the end of each cycle. Most cycles will happen with 2-4 week intervals. They’re meant to:
✅ Understand what worked for the team and what didn’t work
✅ Gathering insights from all team members to understand where the project is really at
✅ Using lessons learned to improve workflow so that work can be done more effectively
While working in so-called cycles seems slow in the beginning, it significantly picks up in speed after a couple of weeks. Making the end deliverable so much faster.
The Fastest Way To Show You’re Moving Forward
Communication is key. And in all honesty, your stakeholders deserve to see something.
In the past I used to make the mistake of “making it perfect” before I would show anything. This is the biggest mistake possible.
Stakeholders want to see progress, not finals.

The first step is to deliver simple sheets with data manipulated into information.
This is not the final thing, no this is communication. What you communicate is:
👌 We’re making progress
🎯 We actually have data you can use
🙏 We want you to be in on this process (i.e. you have a say)
If something is not as they want it, or not as expected, they can communicate back to you now. Before the whole damn thing is built and hours are wasted.
Turning Wireframes Into First Versions
The trick to any good relationship is that sometimes you need to let the other complain. Empty their bucket.
You have more control over that than you think. It’s super simple even: you don’t create a perfect version.
If there’s no perfect version, stakeholders will have feedback. The more feedback stakeholders can give, and you can implement, the more they will like the end result.
It is an absolute must to give space for feedback from your stakeholders. Even if they say they don’t have time for it. Have them make time for it. Take charge.
The Easiest Step, Which Makes The Most Impact
You’re almost there. Now let’s make some impact.
Design is often an underrated thing. People stop before this step, because the information that needs to be displayed is in there, right?
Wrong!
You need to make it enjoyable to use for the end user. And make it look pretty so that they want to use it.
Luckily this is the easiest step of all: hire a design firm once you’ve been through all previous phases.
They’ll gladly make something super pretty for you:

Step 3: Keeping The Quality Of Your Data To High Standards
I learned the hard way that data is never done.
Things change.
Business operations changes. That’s life. And Business.
The worst thing that can happen is when dashboards are not displaying the right information anymore. Other things that can happens:
👉 Third party vendors update their sources.
👉 There are new metrics that need to be added.
👉 New domains are coming into the business.
👉 The dashboards need to be rearranged.
👉 Etc.
I use a very simple excel which I have checked every now and then. Manually. Hiring a Data QA is a low cost investment which will make the biggest impact on your stakeholders.
Being on top of your data = being on top of your game.

The Missing Piece Of The Puzzle: How To Minimize Cost And Adapt Faster
Going through these phases can be complex, time-consuming, and most of all: expensive. The trick to keeping time and money to a minimum is to use a low-code approach next to design thinking.
Low-code is an approach which lets you code with a minimum amount of hand-coding. Me and my team created a graphical interface which makes it super easy to connect the dots:
🚀 Simplifies Development: Low-code platforms reduce the complexity of software development, enabling faster deployment and easier customization.
💸 Cost Efficiency: By minimizing the need for extensive coding, low-code approaches significantly cut down development costs and resource allocation.
💪 Agility and Scalability: Low-code solutions offer the flexibility to quickly adapt and scale as business needs evolve, without extensive downtime or redevelopment.
Here’s The Promised Pitch
I won’t make it a endless sales page, I don’t like those. Here’s what you get if you decide to work with me and my team:
👉 Customized Data Solutions: Tailored strategies to organize and optimize your recruitment data, ensuring it aligns perfectly with your business objectives.
👉 Efficient Systems Implementation: Rapid deployment of easy-to-use, low-code dashboards that enhance data visualization and decision-making processes.
👉 Ongoing Support and Optimization: Continuous assistance and guidance to ensure your data systems evolve with your business needs, maximizing long-term value and efficiency.
Some Final Words of Wisdom
Go through these steps to deliver amazing results to your stakeholders.
Step 1: Discover
🔎 Collect and analyze key stakeholder data needs.
🔒 Establish data governance and security protocols.
✏️ Create ugly first drafts that demand feedback.
Step 2: Design and Implement
💬 Handle communication with third parties to secure data.
⚙️ Develop and refine dashboards based on iterative feedback.
🎨 Make it look pretty.
Step 3: Advise
🤙 Provide ongoing support to update and optimize data systems and dashboards.💡 Use a low-code solution to streamline development, enhance cost efficiency, and improve scalability.
My client had the wrong data for 2 years straight, without even knowing. Me and my team fixed that in just 2 months for a fraction of the cost.

